What is Apache Benchmark?
In the Apache HTTP project’s own words,
ab is a tool for benchmarking your Apache Hypertext Transfer Protocol (HTTP) server. It is designed to give you an impression of how your current Apache installation performs. This especially shows you how many requests per second your Apache installation is capable of serving.
What this means for web developers is we have a free (albeit very simple) benchmarking tool at our disposal. If the vast majority of your application performs well under ab tests, your code is pretty solid (from a performance standpoint). You might not be ready for a Slashdotting, but your users will appreciate the performance gains achieved through this sort of analysis.
Most importantly, this takes the guesswork out of performance testing. It doesn’t just feel or seem faster, but you can prove it to your boss or client with hard data.
Making Sure `ab` is Installed
On Mac OS X you’re all set, it comes bundled. On Windows, you will need to install the Apache HTTPD server and all its components. Linux users, if you haven’t already installed Apache (or your distro included it by default), find a packaged .deb or .rpm, or build Apache from source. More than likely your package manager will have a binary distribution ready for you.
Once the full Apache HTTPD package has been installed, you aren’t required to configure the server itself. ab is a stand-alone command-line utility which works independent of the server.
Basic Command Structure
We start by opening a terminal window. On OS X you can use the Terminal application found in your Utilities folder. On Windows XP, Start > Run > cmd will open a command prompt for you. More simply, all of these commands will run fine on any dedicated Apache web server.
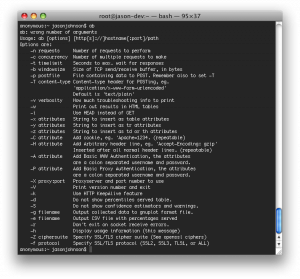
A basic ab command is very straightforward:
Two of the most used options are -c [number] and -n [number]. -c allows us to specify how many connections we want to open concurrently. In this case, we’ve set that option to 10. -n allows us to specify how many total request we’d like to make. In our case above, we will be sending a total of 1,000 requests.
An Example
Using PHP’s usleep() function, I wrote a one-line script that allows me to sleep PHP’s execution for a certain number of microseconds.
<?php usleep(500000); ?>
It simply waits a certain number of microseconds (in this case 500,000 – which equates to 500ms) and exits. This will simulate a long-running process or an intense database query.
Now we apply a load to the script using the ab command. This particular site is hosted on a powerful machine, so we can be aggressive with our test. However, you can observe performance issues with very small, lightweight tests.
ab -c 10 -n 1000 http://www.jasonjohnson.org/ab-test.php
Understanding the Output
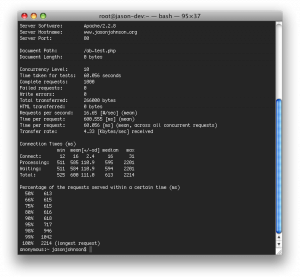
The single most important metric to a web developer is the first entry of Time per request. This is the average time it took for each request to make its round-trip: connect to the web server, request the document, the web server finds the document, executes the contents of the document, returns the output and transfers it across the wire back to the client.
Note: If metrics like Failed requests or Write errors are larger than 0, it might be a good idea to enlist the help of a system administrator, another developer, or a mailing list. At this point, it is likely your performance problems can be linked to an infrastructure issue and not entirely a code issue.
Tweak, Rinse and Repeat
Knowing our average request took ~600ms, we can reduce that to 100ms of overhead (maybe data transfer across the network or our web server simply taking its time), and our explicit 500ms of sleep we’ve scripted. We know there is room for improvement.
Lets reduce the microsecond count to 100,000 microseconds (or 100ms) and run the test again.
<?php usleep(100000); ?>
You must make sure you are using the exact same command structure as before. Modifying concurrency or number of requests introduces additional variables to our testing. As such, our results wouldn’t be as reliable.
ab -c 10 -n 1000 http://www.jasonjohnson.org/ab-test.php
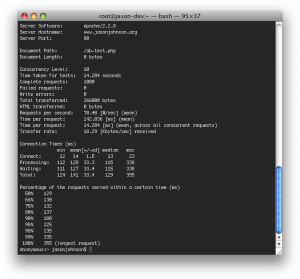
According to the first entry of Time per request we’ve gone from 600ms per request to just over 140ms. Of course, there are all kinds of factors at play here. Your local network latency, your web host facilities network latency, variable load on the web server, etc. Regardless, on a pure percentage basis we have seen a drastic performance increase.
That’s all! …but what next?
I hope you have enjoyed this tutorial, now try it (gently!) on your own sites and services and see if you can realize performance increases. I would love to hear of any performance gains you’ve made, so please share your experiences in the comments.
If you have any suggestions for future tutorials (or feedback on this one), I would appreciate them.
License

Web Application Performance Tuning with ApacheBench by Jason Johnson is licensed under a Creative Commons Attribution 3.0 United States License.
Based on a work at www.unmatchedstyle.com.
Translations
Translations of this article are permitted and full translations will receive forwarding links in-kind, so make sure to link back to the original article. Thank you!


0 Comments